
Which DC Schools Are Actually Improving — and Which Just Got Whiter?
DCPS test scores are up. But the school-level data tells a more complicated story about gentrification, COVID recovery, and genuine instructional gains.
DC Public Schools released its 2024-25 test score data this summer, and the top-line numbers look encouraging. System-wide ELA proficiency hit 42.8 percent, surpassing the pre-COVID level of 40.2 percent for the first time. Math proficiency rose to 30.8 percent — still below the pre-pandemic 32.6 percent, but the biggest single-year gain in the post-COVID era.
But when you look at the school-level data — comparing individual schools' proficiency rates in 2024-25 to where they were in 2018-19, the last pre-COVID year — a more complicated picture emerges. Some of the biggest apparent "improvers" turn out to be schools where the student body has changed dramatically, with rising White enrollment mechanically pushing up proficiency rates. Meanwhile, other schools have achieved genuine, sustained gains with largely stable demographics. And a troubling group of schools crashed during the pandemic and have never recovered.
The big picture
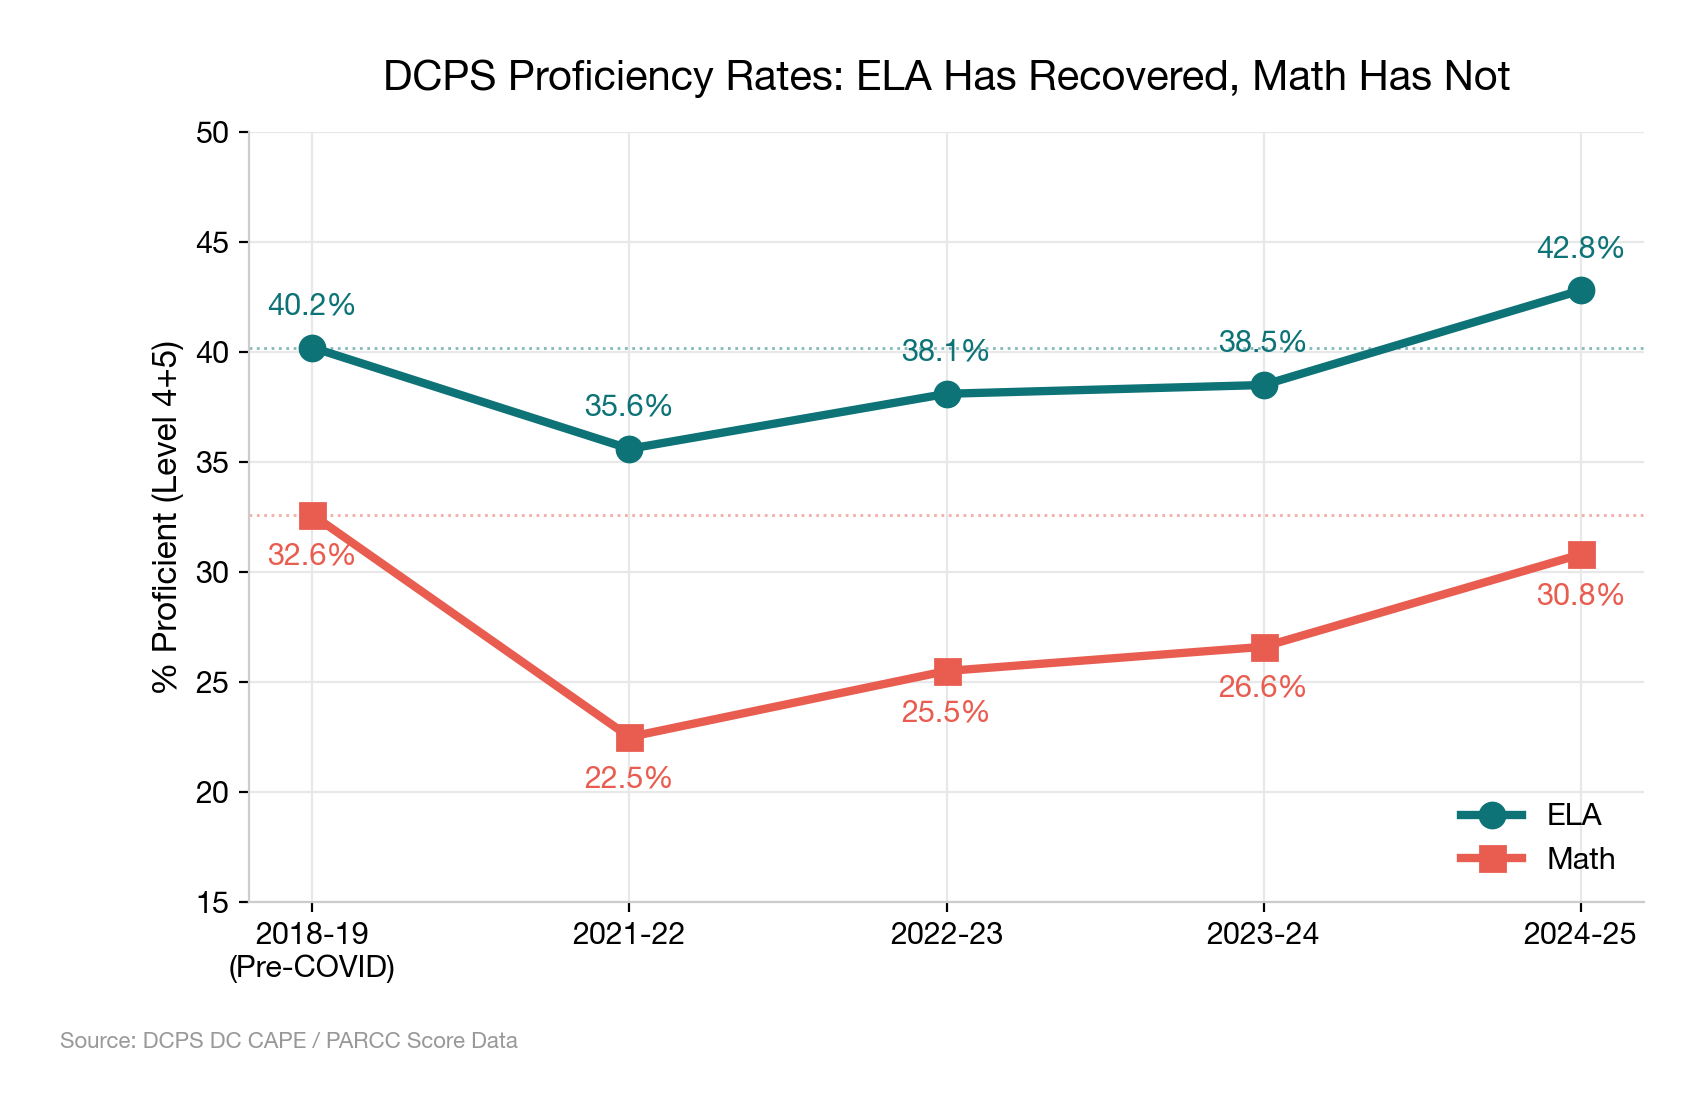
The system-wide trajectory shows a clear COVID shock followed by gradual recovery. ELA proficiency dropped 4.6 percentage points from 2018-19 to 2021-22 (the first post-COVID testing year), then climbed back over three years. Math was hit harder — it fell more than 10 points — and still hasn't fully recovered, though 2024-25's jump of 4.2 points was the strongest single-year gain yet.
But the system-wide numbers mask enormous variation at the school level. Of 108 schools that can be compared across both years, 56 improved in ELA and 52 declined. In math, only 39 improved while 67 declined. Some schools gained 20+ percentage points; others lost just as much. The question is what's driving those differences.
The schools that got whiter
Several of the schools with the biggest apparent score gains have experienced significant demographic shifts — specifically, a decline in the share of Black students and a rise in White enrollment. Given that White students in DCPS have an 87.8 percent ELA proficiency rate compared to 28.5 percent for Black students, even modest changes in racial composition can move a school's overall numbers substantially.
Burroughs Elementary posted the single largest ELA gain in the entire district: from 25.3 percent proficient to 52.0 percent, a jump of 26.7 percentage points. Impressive — until you notice that the school's Black student share dropped from 93 percent to 68 percent, while White and Hispanic students each grew to about 15 percent of the student body. A school that was almost entirely Black is now substantially more diverse, and its scores reflect that compositional change as much as any instructional improvement.
The same pattern shows up at Shepherd Elementary (+14.7 points, Black students from 79 to 50 percent, White from 11 to 25 percent), Payne Elementary (+14.2 points, Black from 95 to 69 percent, White from too-few-to-count to 21 percent), and Hearst Elementary (+17.1 points, Black from 28 to 14 percent, White from 49 to 57 percent).
To be clear: demographic change doesn't mean nothing improved at these schools. It's possible — even likely — that instruction got better too. But you can't look at Burroughs' 27-point ELA gain and attribute it to teaching when the student body transformed over the same period. The top-line score improvement substantially overstates whatever instructional progress occurred.
Schools where the gains look real
More interesting — and more encouraging — are the schools that improved substantially without major demographic shifts. These are the schools where something genuinely seems to have changed in the classroom.
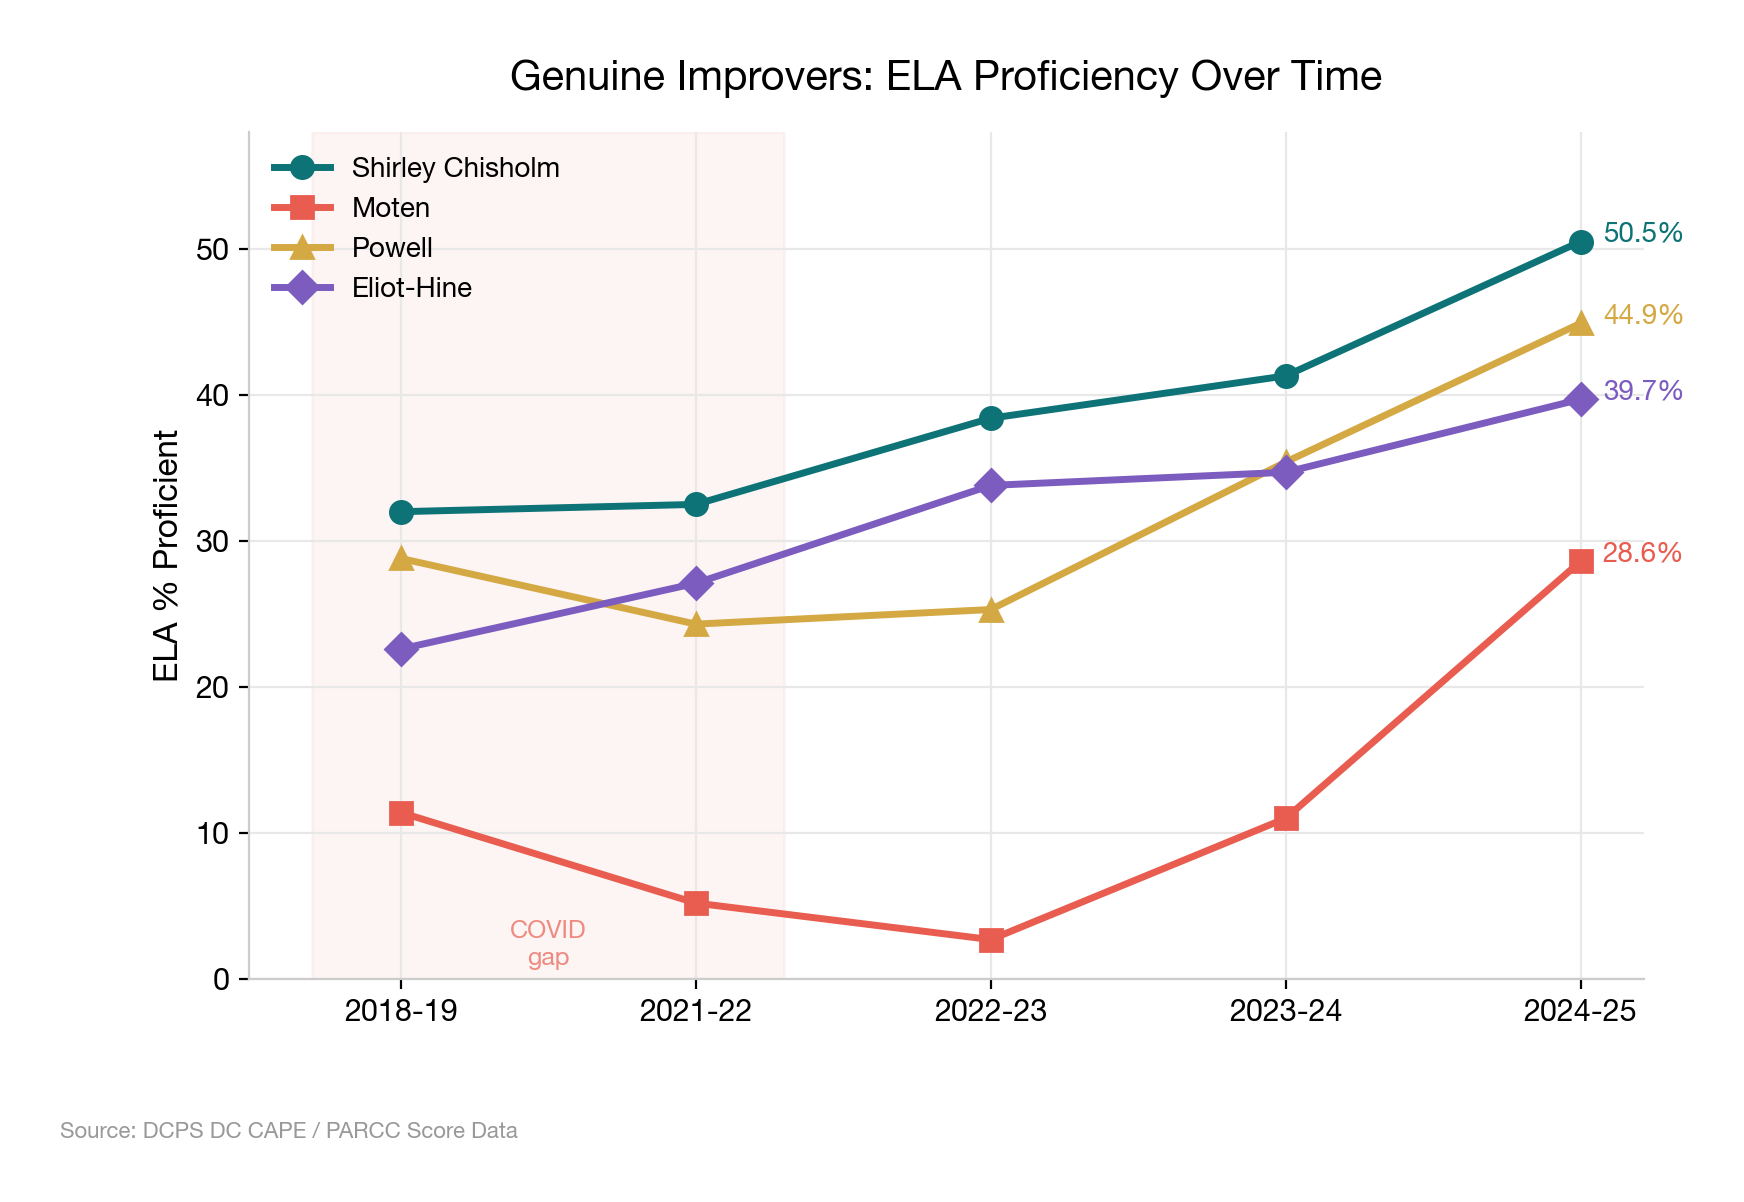
Shirley Chisholm Elementary, in Congress Heights, shows the most convincing trajectory of any school in the district. Its ELA proficiency has risen steadily every single year: 32 percent, 33 percent, 38 percent, 41 percent, 51 percent. No COVID crater, no sharp swings — just consistent, year-over-year improvement. Its student body is still about two-thirds Black and 13 percent Hispanic. Its math scores have followed the same upward trajectory, from 25 percent to 41 percent. Whatever Shirley Chisholm is doing, it's working.
Moten Elementary, also in Southeast, has a more dramatic story. The school stayed nearly 99 percent Black throughout and actually shrank from 132 to 77 tested students. Its scores collapsed during COVID — ELA proficiency fell to 2.7 percent in 2022-23, meaning roughly two students in the entire school hit proficiency. But it has rebounded sharply since, reaching 28.6 percent in 2024-25. That's still not a good number in absolute terms, but the trajectory — a 26-point gain in two years with no demographic change — suggests real instructional turnaround.
Powell Elementary in Petworth has maintained a heavily Hispanic student body (72 percent) while improving from 28.8 to 44.9 percent ELA proficiency. Most of the gain came in the last two years. Eliot-Hine Middle School, which has more than doubled in enrollment, has seen consistent ELA gains from 22.6 to 39.7 percent — though some demographic shift (Black students from 86 to 73 percent, White from 7 to 16 percent) complicates the picture somewhat.
Schools that never recovered
The most troubling finding in the data is the cluster of schools that suffered massive COVID-era declines and have shown little to no recovery five years later.
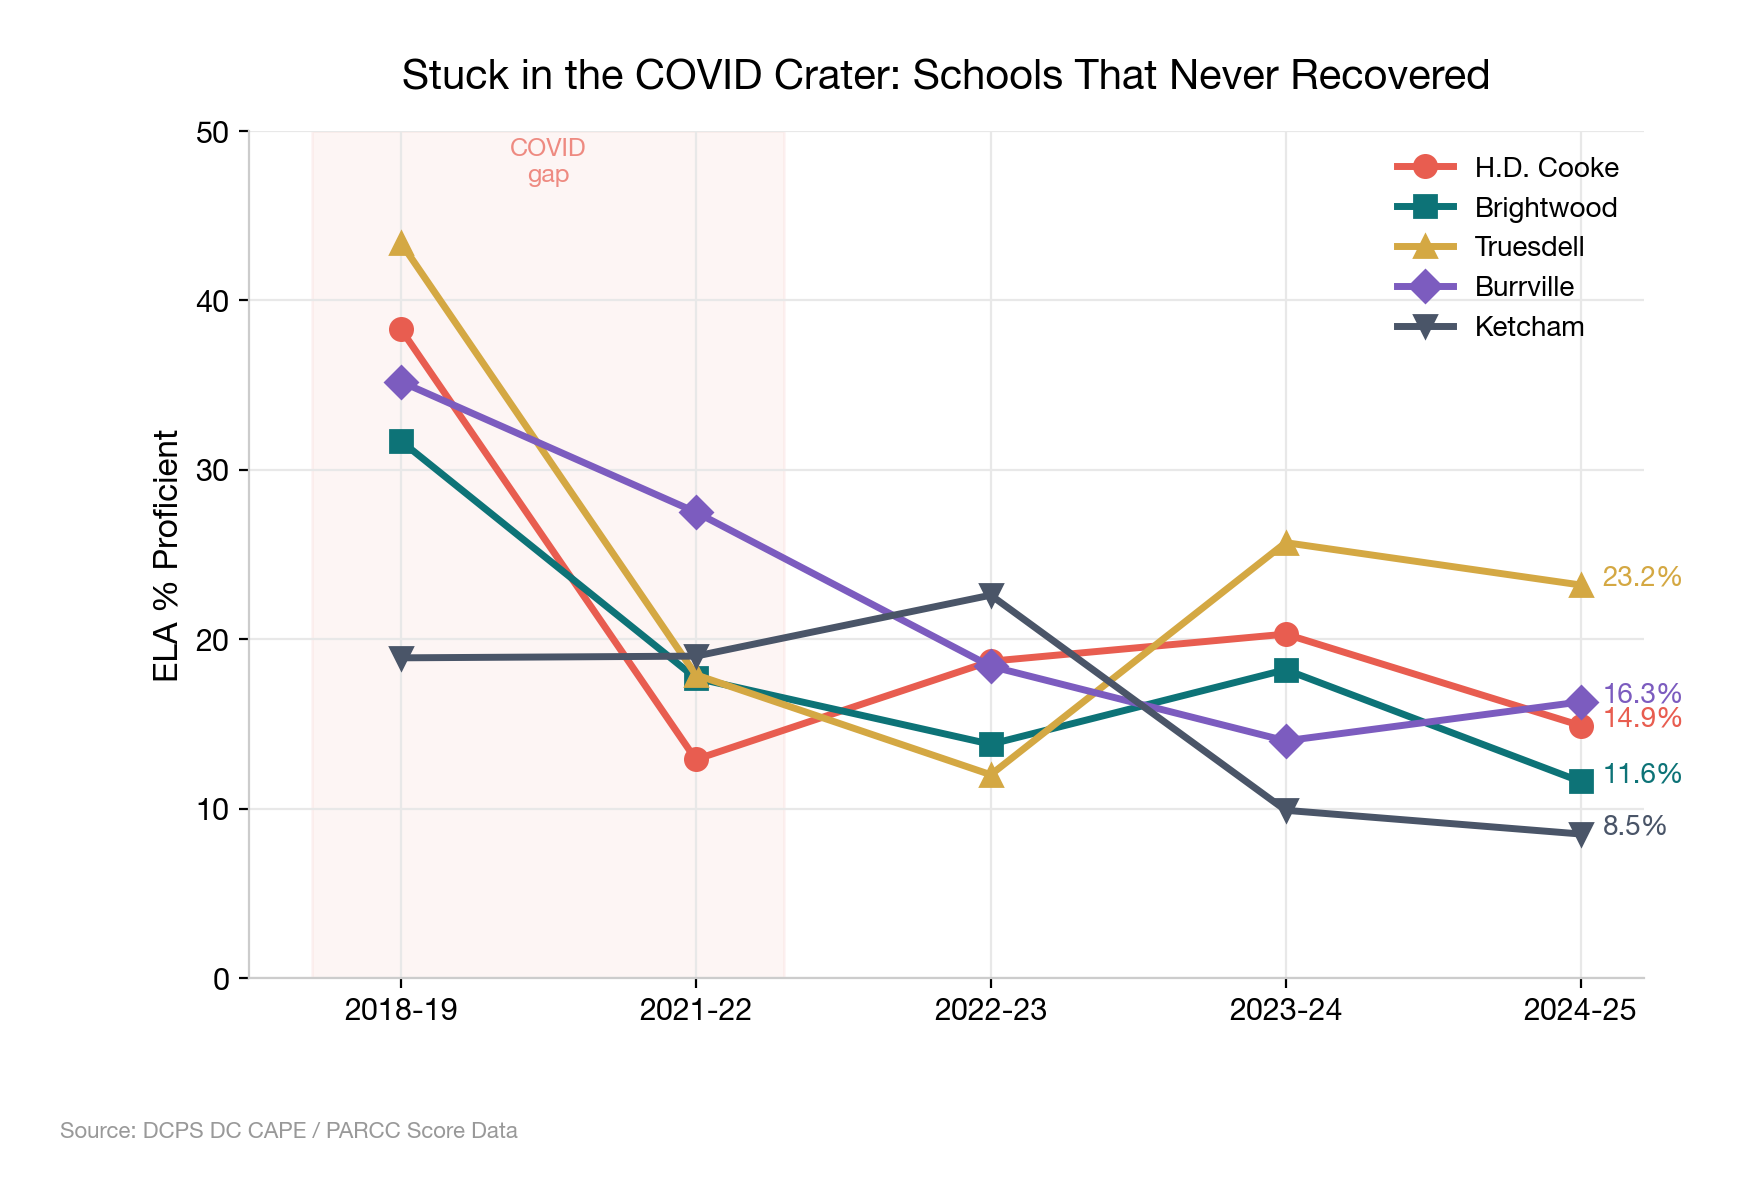
H.D. Cooke Elementary in Adams Morgan fell from 38.3 percent ELA proficiency in 2018-19 to 12.9 percent in 2021-22. Four years later, it's at 14.9 percent — essentially no recovery at all. The school's demographics are largely stable (majority Hispanic) and its enrollment hasn't changed much. Its math scores tell the same story: from 42.3 percent to 15 percent. This is a school that lost 25 percentage points and never got them back.
Brightwood Elementary, a large, predominantly Hispanic school in upper Northwest, dropped from 31.7 to 11.6 percent ELA proficiency — while also losing nearly 150 students, from 391 to 242 tested. The combination of falling scores and shrinking enrollment suggests families who have options are leaving. Truesdell Elementary shows the same pattern: scores cut in half, enrollment down from 309 to 138.
Burrville Elementary in Ward 7, nearly all-Black with stable enrollment, dropped from 35.2 to 16.3 percent ELA proficiency. And Ketcham Elementary experienced the single largest math decline of any school in the district: from 35.1 percent to 3.7 percent — a 31.5 point collapse. At Ketcham, 3 out of 82 students are proficient in math.
What these schools share is that the pandemic wasn't a temporary shock for them — it was a permanent downward shift. The students who lost ground during school closures moved on to the next grade, and the next, without ever catching up. And the schools themselves haven't found a way to reverse the damage.
The gap underneath it all
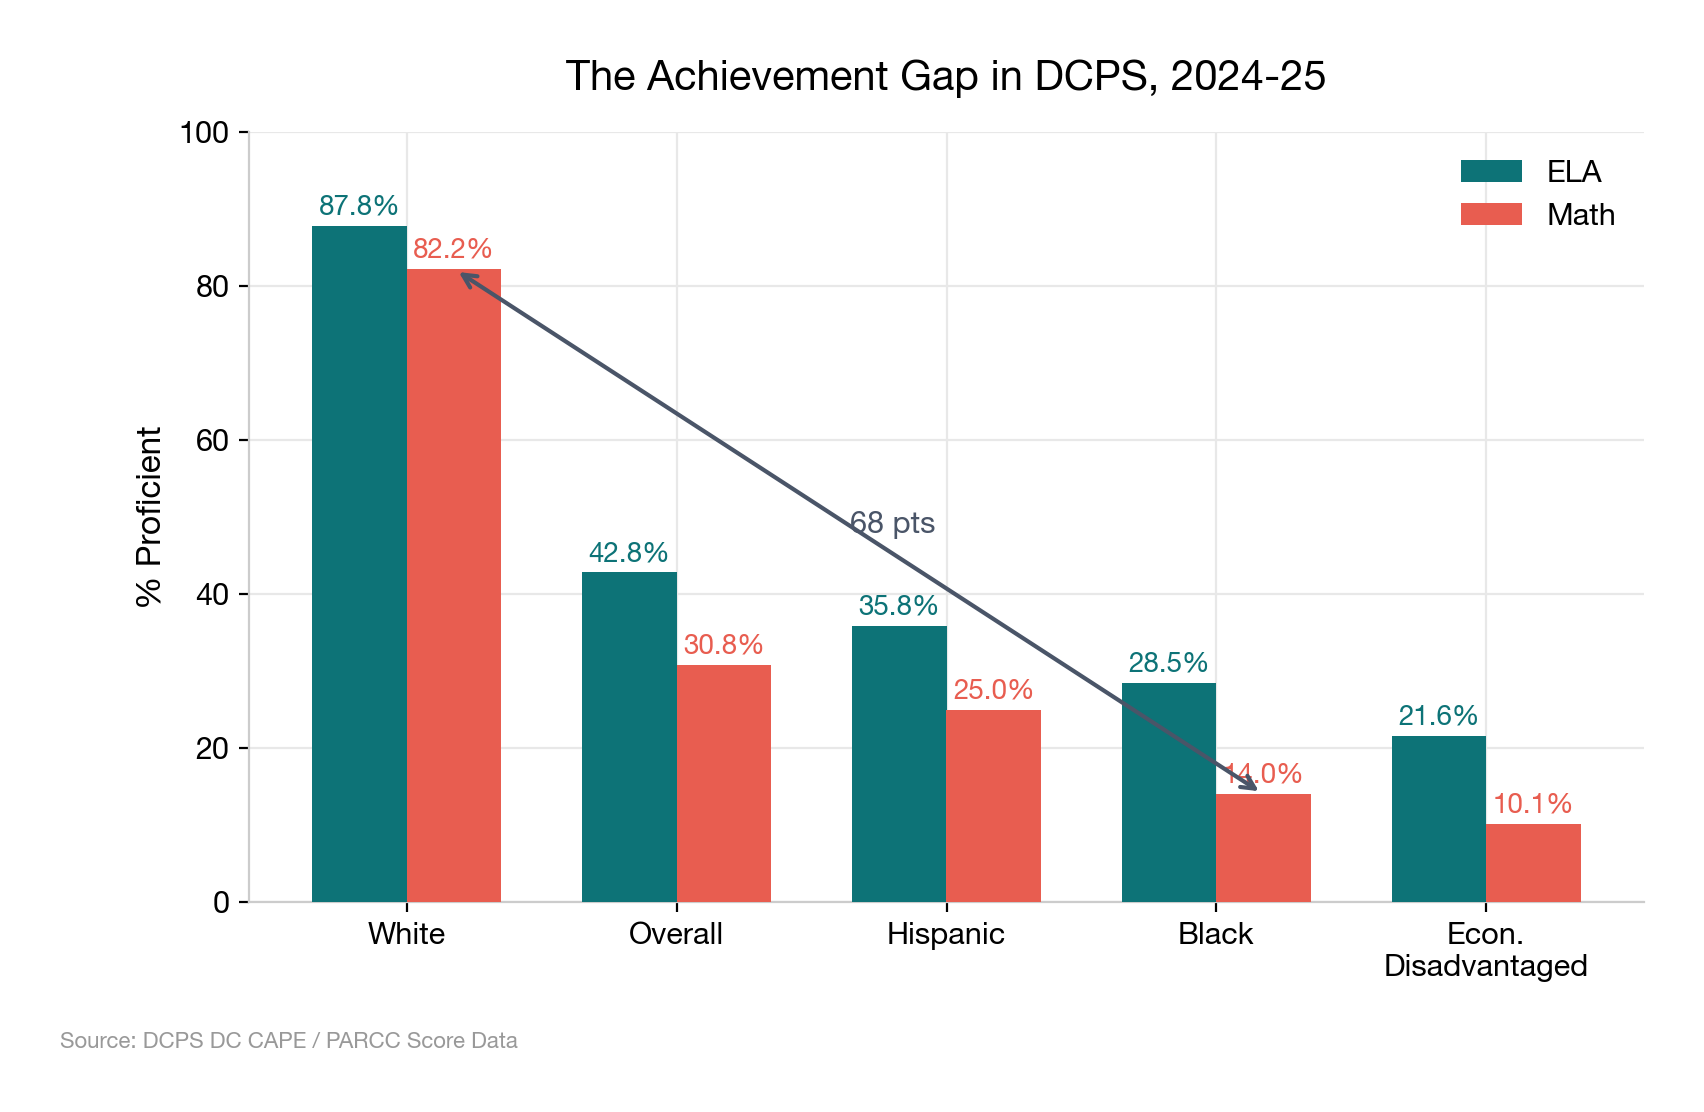
All of this plays out against the backdrop of an enormous racial achievement gap. In DCPS, 87.8 percent of White students are proficient in ELA. For Black students — who make up the majority of enrollment — it's 28.5 percent. In math, the numbers are 82.2 percent and 14.0 percent, a gap of 68 percentage points.
This means that when a school's demographic composition shifts — even modestly — the overall proficiency number can move dramatically without any change in how well the school is actually teaching. A school that goes from 90 percent Black to 70 percent Black, adding White students who arrive already proficient, will show a significant jump in its overall rate. The school hasn't gotten better at educating its existing students. It just has different students.
Economically disadvantaged students — about 45 percent of DCPS test-takers — fare even worse: 21.6 percent ELA proficiency, 10.1 percent math. Only one in ten low-income DCPS students is proficient in math. That number should be at the center of every conversation about school quality in the District.
Reading the scoreboard honestly
DCPS publishes this data every year, and every year the system-wide averages get the headline. This year's numbers genuinely are encouraging — ELA proficiency above pre-COVID levels, the biggest math gains in years. But school-level score changes are being driven by at least three separate forces: actual instructional improvement, demographic change from gentrification, and uneven COVID recovery. Treating the top-line number as a simple measure of school quality misses all of this.
The schools to celebrate are the Shirley Chisholms and the Powells — places where largely the same population of students is doing measurably better, year after year. The schools to worry about are the H.D. Cookes and the Ketchams — places where the pandemic's damage has calcified into a new, worse normal. And the schools to be honest about are the Burroughses and the Shepherds — places where the numbers look great but the story is as much about who's enrolling as about what's being taught.
The test data DCPS publishes includes breakdowns by race and income for every school. Anyone can check whether a school's gains hold up across subgroups, or whether they're being driven by compositional change. More people should.
Data source: DCPS DC CAPE and PARCC Score Data. Analysis compares 108 DCPS schools with at least 30 test takers in both 2018-19 and 2024-25. Proficiency is defined as Level 4 or Level 5 on the DC CAPE assessment (formerly PARCC).